Last Updated on June 8, 2026 by Gaurav
Have you ever thought about someone who is working in the United States and earning $30,000 a year is richer than someone who is working in India and earning ₹15 Lakhs per year? Well, that might not technically be the case. The answer simply lies in a concept that is used by economists to compare economies in a fair and somewhat accurate manner. The concept is called Purchasing Power Parity, or PPP.
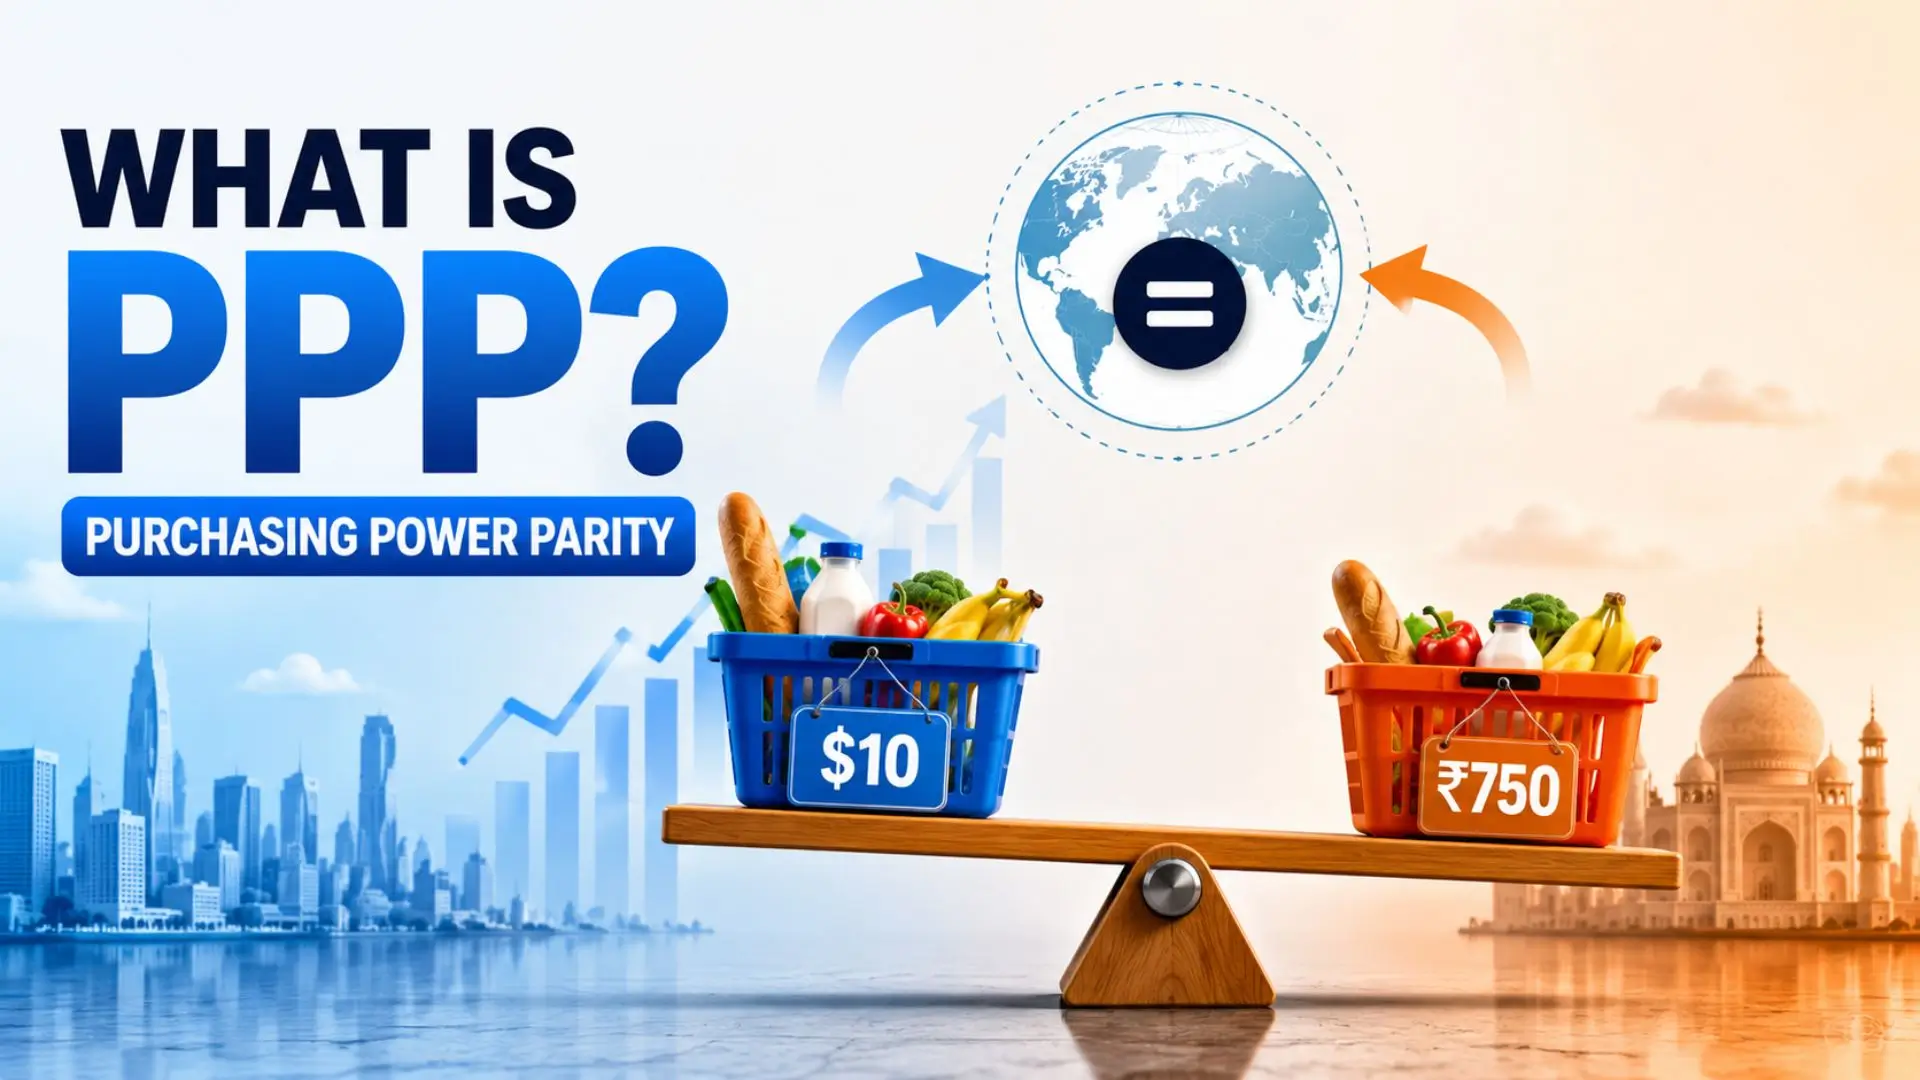
Purchasing Power Parity: Definition
In simple terms, Purchasing Power Parity is a way of comparing the value of money of different countries by looking at the things that the money can actually buy.
This simply means that instead of comparing how much money people earn, PPP checks how much of the same things the money can buy in different countries.
Let’s understand this by an example – If a plate of dal chawal costs ₹50 in India and the same meal is for $5 in the U.S. then both the amounts are equal in terms of purchasing power. However, these amounts are not equal in terms of exchange rate.
READ| Gross Domestic Product (GDP) Importance, Types, Formula
Why Can’t We Use Exchange Rate Instead of Purchasing Power Parity?
Exchange rate is a simple calculation that tells you how much a currency costs in terms of the other. For example – $1 = ₹94 (average). This comparison can’t tell you what the currency can buy inside its own country.
To put this in perspective, a haircut in a city in India could cost ₹200 but a same haircut could be $20 in the U.S. The service is exactly the same. This shows that it is comparatively cheaper to live in India. PPP is established just to correct this difference.
What is the Big Mac Index?
This is one of the most famous examples of Purchasing Power Parity. The Big Mac Index was first brought to use by The Economist in 1986.
The concept is that a McDonald’s Big Mac burger is sold in over 100 countries. It is made the same way everywhere. So if you compare what a Big Mac costs in different countries, you get a rough idea of whether currencies are overvalued or undervalued.
The World Population Review mentions: “The Big Mac Index is a price index, first introduced by The Economist in 1986, that tracks the price of a McDonald’s Big Mac cheeseburger in each country, thereby offering a quick and easily digestible country-to-country comparison of purchasing power parity (PPP) and currency values all over the world.”
How is Purchasing Power Parity Calculated?
There is not just a single product that is calculated in Purchasing Power Parity. Instead, economists compare a large basket of goods and services that are common across countries, such as food, clothing, rent, transport and healthcare.
The comparison is made on the basis of the price of these baskets and also calculate what exchange rate would bring the prices equal. This is what the PPP exchange rate is.
Data by the World Bank and International Monetary Fund (IMF) are regularly published through a programme called the International Comparison Program (ICP).
PPP and GDP: Where Does India Stand?
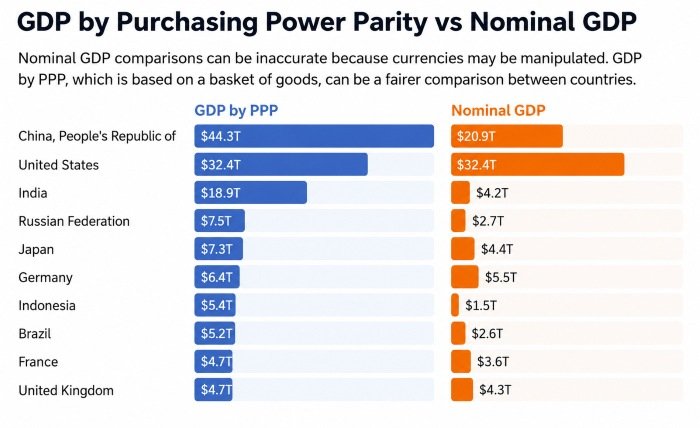
Source: Investopedia
This is where PPP becomes truly fascinating for India. When we rank countries by GDP using market exchange rates which is called nominal GDP, then India’s economy is around $4.2 trillion, according to the IMF.
But when we measure the GDP of India using PPP, then it gets quite larger. This is because the same rupee buys far more inside India than a dollar does inside the USA. Here is the data as per Worldometer:
| Rank | Country | GDP (PPP) | GDP (PPP) per Capita |
| 1 | China | $44.3 trillion | $31,596 |
| 2 | United States | $32.38 trillion | $94,430 |
| 3 | India | $18.9 trillion | $12,801 |
| 4 | Russia | $7.53 trillion | $52,479 |
| 5 | Japan | $7.26 trillion | $59,207 |
| 6 | Germany | $6.41 trillion | $76,747 |
| 7 | Indonesia | $5.45 trillion | $18,973 |
| 8 | Brazil | $5.23 trillion | $24,428 |
| 9 | France | $4.73 trillion | $68,567 |
| 10 | United Kingdom | $4.72 trillion | $67,585 |
India’s GDP at PPP is at $18.9 trillion as of May 2026. On a PPP basis, India contributes approximately 8.48 percent of the entire world’s GDP.
India vs Its Neighbours: What the Data Shows
The NCERT shows GNI per capita in PPP terms for India as well as its neighbours. Here is what the data shows:
| Country | GNI per Capita (2021 PPP $) | Life Expectancy | HDI World Rank |
| Sri Lanka | $12,616 | 77.5 years | 89 |
| India | $9,047 | 72 years | 130 |
| Bangladesh | $8,498 | 74.7 years | 130 |
| Pakistan | $5,501 | 67.6 years | 168 |
| Nepal | $4,726 | 70.4 years | 145 |
| Myanmar | $4,919 | 66.9 years | 150 |
India sits at rank 130 on the Human Development Index as per Human Development Report, 2025, which is quite surprising. Sri Lanka, a much smaller country, is at rank 89 and has a higher per capita income, longer life expectancy and more years of schooling than India.
Absolute PPP vs Relative PPP
There are two concepts of PPP that can be quite confusing. The first one is Absolute PPP which says that the exchange rate between two currencies should equal the ratio of price levels in the two countries.
To put it simply, the same basket of goods should cost the same in both countries when they are converted to a common currency.
On the other hand there is Relative PPP which takes a more flexible approach. It says that changes in the exchange rate over time should reflect changes in inflation rates between the two countries. If India has higher inflation than the US, the rupee should depreciate against the dollar over time.
Relative PPP is considered more practical and is more often used in real-world analysis.
What are the Limitations of PPP?
PPP is a powerful tool, but it is not perfect. Here are some of its limitations:
- Not all goods are tradeable. For example – a haircut, a school fee or a hospital visit cannot be bought in one country and shipped to another. So comparing their prices does not fully reflect currency value.
- Quality differences are there. A Rs. 50 meal in India and a $5 meal in the US may not be equal in ingredients, hygiene or experience. Comparing them as equal is an approximation.
- Data collection is difficult. Getting accurate and comparable price data from every country is a massive task. The ICP does this work, but there is always a margin of error.
- PPP adjustments happen slowly. Real exchange rates move daily, but PPP benchmark revisions happen only every few years.
Key Terms to Remember
- PPP (Purchasing Power Parity): A method to compare the value of money in different countries based on what it can actually buy.
- PPP Exchange Rate: The exchange rate at which a basket of goods would cost the same in two countries.
- GNI per Capita (PPP): Gross National Income per person, adjusted for price differences across countries. This is the measure used in the NCERT textbook and the UNDP Human Development Report.
- Big Mac Index: An informal, simplified tool to understand PPP using the price of a McDonald’s Big Mac across countries.
- GDP at PPP: A country’s total economic output adjusted for price differences. India ranks 3rd globally by this measure.
- Absolute PPP: Exchange rates should equalize price levels between countries.
- Relative PPP: Exchange rate changes over time should reflect inflation differences between countries.
Purchasing Power Parity compares what money can actually buy across countries, not just its face value. India is the third largest economy in the world on a total PPP basis. The IMF and World Bank use PPP data to measure real living standards, calculate poverty thresholds and rank countries. The Big Mac Index is the most popular everyday example of PPP.
Stay connected with GKinfoBuzz for more informative articles on general knowledge topics to help you expand your understanding.